Visual annual report
Visual annual reports go above and beyond their traditional counterpart, providing a quick, crystal-clear insight into your financial position.
View the example
Visual annual report
Reviewing figures through a visual annual report – what does that actually mean? And how does it compare to a traditional annual report?
The answer is insight: a crystal-clear look at your SMEs financial position and information you can use to make informed decisions. The visual annual report truly goes a step beyond the standard version.
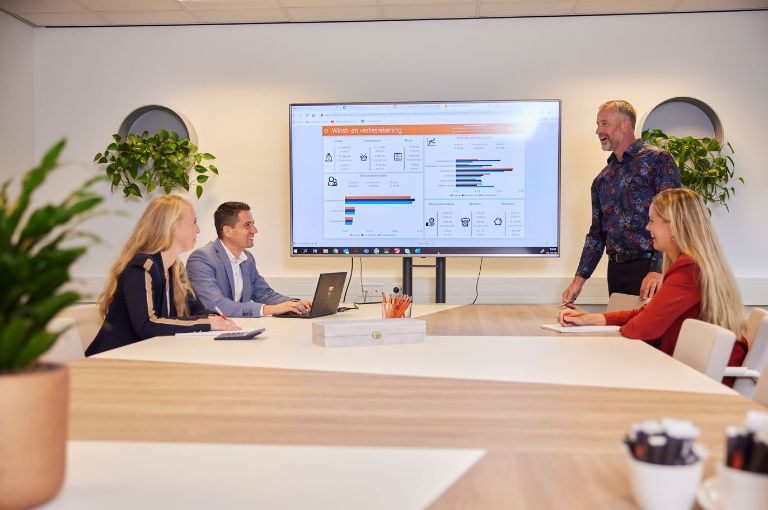
It presents your business flows in a clear, visual format and lets you zoom in on specific details, such as your top 10 clients or revenue per customer.
Curious about what the visual annual report can do for you? Explore the example below and see for yourself:
Frank Hop
Partner Accountancy
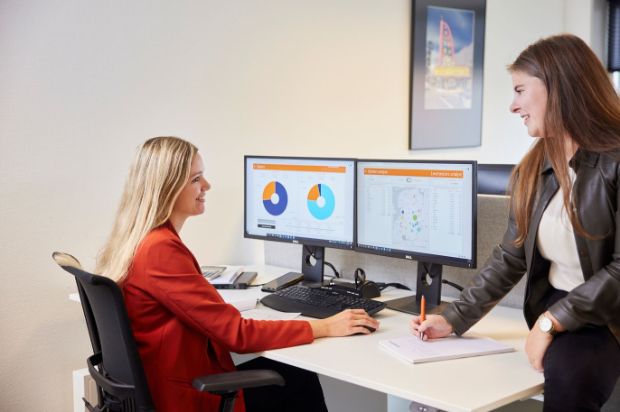
Track month-by-month developments
A key benefit of the visual annual report is the ability to compare figures across different periods. By arming you with deeper insight into developments over time, it helps you identify concrete action points to improve your processes. What's more, our accountants are here to support you along the way and help explore opportunities for your SME.
Take charge of your goals
Do you ever ask yourself:
- What do I need to do to turn my investment plans into reality?
- Would an investment be financially responsible?
- Who are your my important customers?
- Should I hire new staff or not?
- Would changing to a different legal structure make sense?
If so, the visual annual report is a powerful tool that provides real-time insights. Our accountants walk you through the key figures and help you answer these questions, so you can make confident, well-informed decisions.
Get in touchLet's go for it together
We're incredibly proud to have won an award with our visual annual account!
De Jong & Laan has won a Power Platform for Accountants Award for its visual annual report. Microsoft and the Power Platform for Accountants team presented the award online to Jasper and Hans-Friedrich from the IT Advisory department. They proudly accepted the award!
Waar wil je meer over weten?
10.000+