Visual
annual report
So what exactly does it mean to discuss your numbers using a visual annual report? And what makes it more valuable than the traditional version? With a clear and visual overview, you immediately see where your business stands financially. You can zoom in on specific details and track developments month by month, making the figures easier to understand and more actionable.
View the example
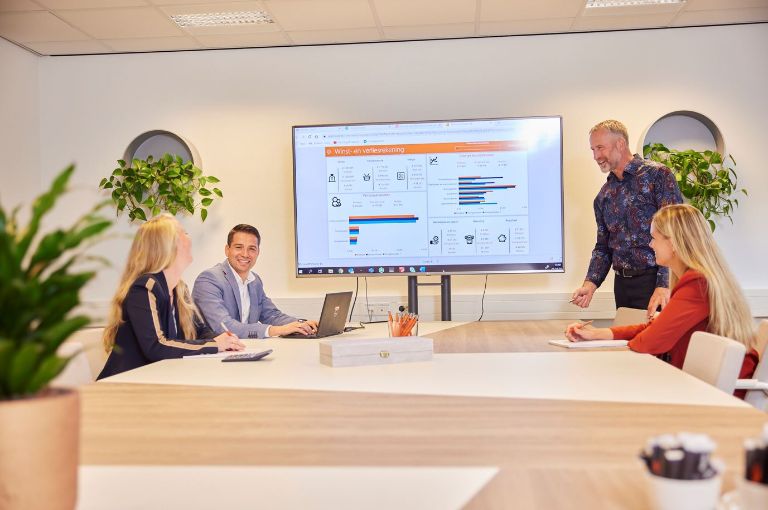
Visual annual report: more insight & faster decision-making
You want clarity. See exactly how your SME is performing financially and use that insight to make well-informed decisions. The visual annual report takes you a step beyond the traditional annual report, showing your P&L and balance sheet, as well as the underlying trends that influence your business.
With the visual annual report, you gain insights such as:
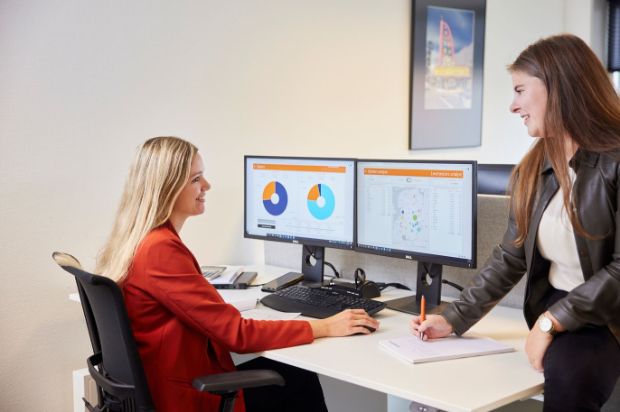
- Financial performance: review P&L, balance sheet, and liquidity in clear, easy-to-read charts.
- li>Top 10 customers and suppliers: see who has the greatest impact on your revenue and costs.
- Revenue by period: track trends and respond proactively to developments.
- HR data: understand payroll costs and staff churn.
- Industry benchmarks: compare your company’s performance with peers in the sector and uncover opportunities.
Curious about what the visual annual report can do for you? Explore the example below and experience the benefits for your own business.
Why?
Financial insight
See at a glance how your business performed over the past year.
Other insights
Get insights into turnover and gross margin per customer or location.
Multiple companies
Combine results from multiple companies into one clear overview.
Track month-by-month developments
A key benefit of the visual annual report is the ability to compare figures across different periods. By arming you with deeper insight into developments over time, it helps you identify concrete action points to improve your processes. What's more, our accountants are here to support you along the way and help explore opportunities for your SME.
Take charge of your goals
Do you ever ask yourself:
- What do I need to do to turn my investment plans into reality?
- Would an investment be financially responsible?
- Who are your my important customers?
- Whether you should hire new staff or not?
- Would changing to a different legal structure make sense?
The a visual annual report could provide you with real-time insights. Our accountants walk you through the key figures and help you answer these questions, so you can make confident, well-informed decisions.
Get in touch
Let's go for it together
What would you like to know more about?
10.000+