Click here to experience it for yourself
Curious about what the HR dashboard can offer your organisation? Explore the dashboard below and experience the benefits for yourself:

Together, we'll take steps to improve your digital management information. You rely on data from various applications when it comes to managing your organisation. But what if:
We analyse your administrative processes, deploy applications intelligently, and provide strategic guidance. In doing so, you optimise operations and turn data into practical insights, providing you with up-to-date and relevant KPIs.
The management dashboard links financial and operational data sources and displays key management information and KPI statuses. Gain real-time insight into your company’s trends and developments from one, central point. The management dashboard lets you easily compare the current situation to last year, for example, or a previous budget. We’re happy to help you build and implement a custom management dashboard.
Read more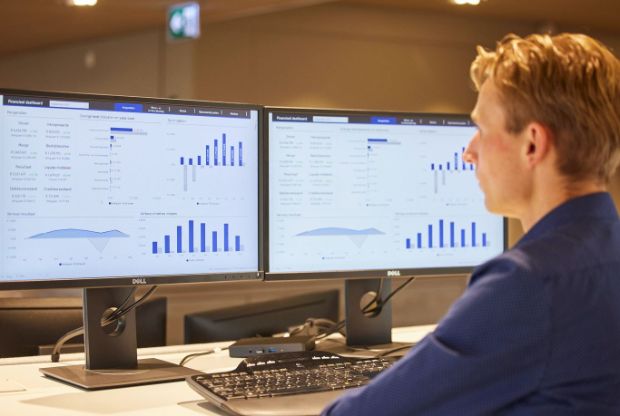

The HR dashboard provides a complete overview of all the essential information for the HR department and management, including absence levels, ongoing trial periods, current & expiring contracts, payroll costs, and leave. With the HR dashboard, you no longer need to analyse separate systems in detail or create periodic reports manually, saving you a lot of time!
Read more
Curious about what the HR dashboard can offer your organisation? Explore the dashboard below and experience the benefits for yourself:
An important aspect of Business Intelligence (BI) is data quality – its reliability and completeness – as well as how and where data is stored and accessed. Do you need a data warehouse, or could you use a direct connection to your data sources? Which processes or applications need to be adjusted to effectively leverage your data? The purpose of using BI tools is to make conscious, data-driven decisions at operational, tactical, and strategic levels. We're happy to help you explore your options.

Inaction is never an option for Preston Palace
Inaction is never an option for Preston Palace. Together with de Jong & Laan, it took major steps towards digital management information. Carlo (Preston Palace): " With our IT consultant Jasper Visserman, we embarked on a process to link and lay bare all our information flows."