Agriculture dashboard
Agriculture dashboard
In responding to current developments in the agricultural sector as quickly and effectively as possible, you’ll face decisions that impact your revenue and liquidity. Making the right choices calls for crystal-clear insight into your own agricultural business.
That's where the Agriculture dashboard comes in. This user-friendly, clear dashboard provides real-time insight into key financial metrics, helping you make timely adjustments. The agro dashboard is designed for:
- Dairy farmers
- Pig farmers
- Arable farmers
- Poultry farmers
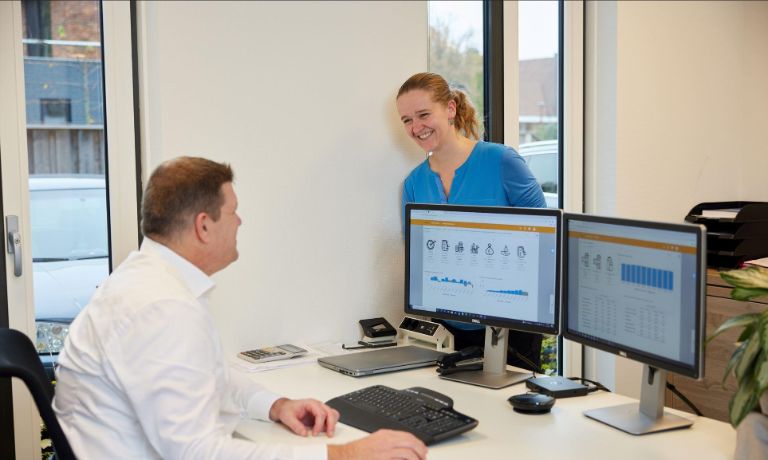
Our advisors
Dairy
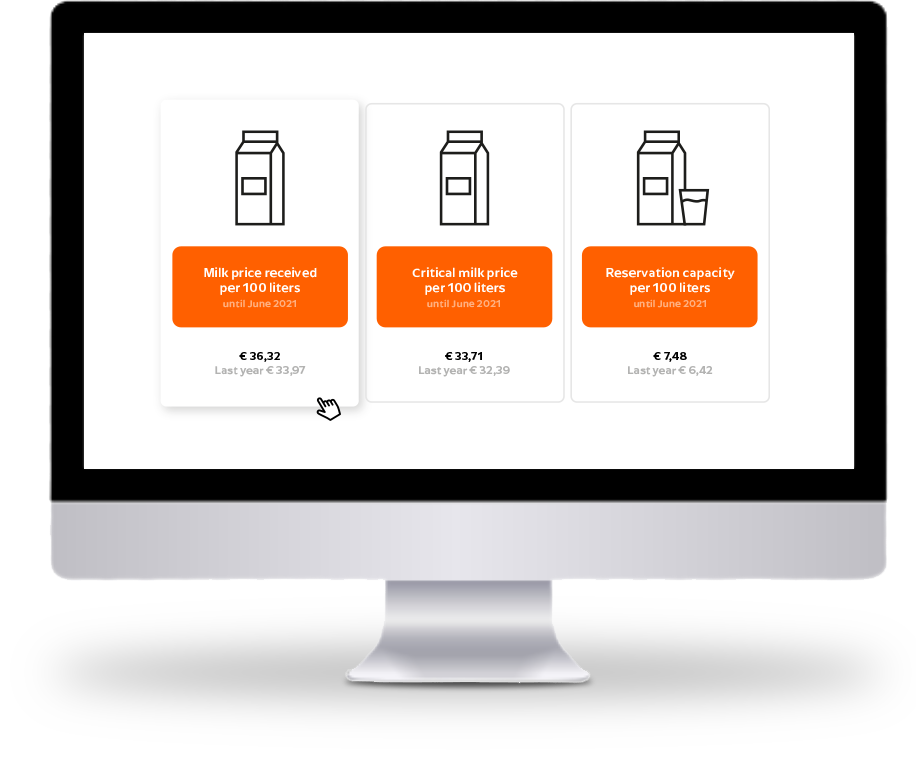
For dairy farmers, the agriculture dashboard provides insight into key P&L figures per 100 litres of milk delivered. The dashboard distinguishes between the:
- Milk price received
- Critical milk price
- Reserve capacity per 100 kg
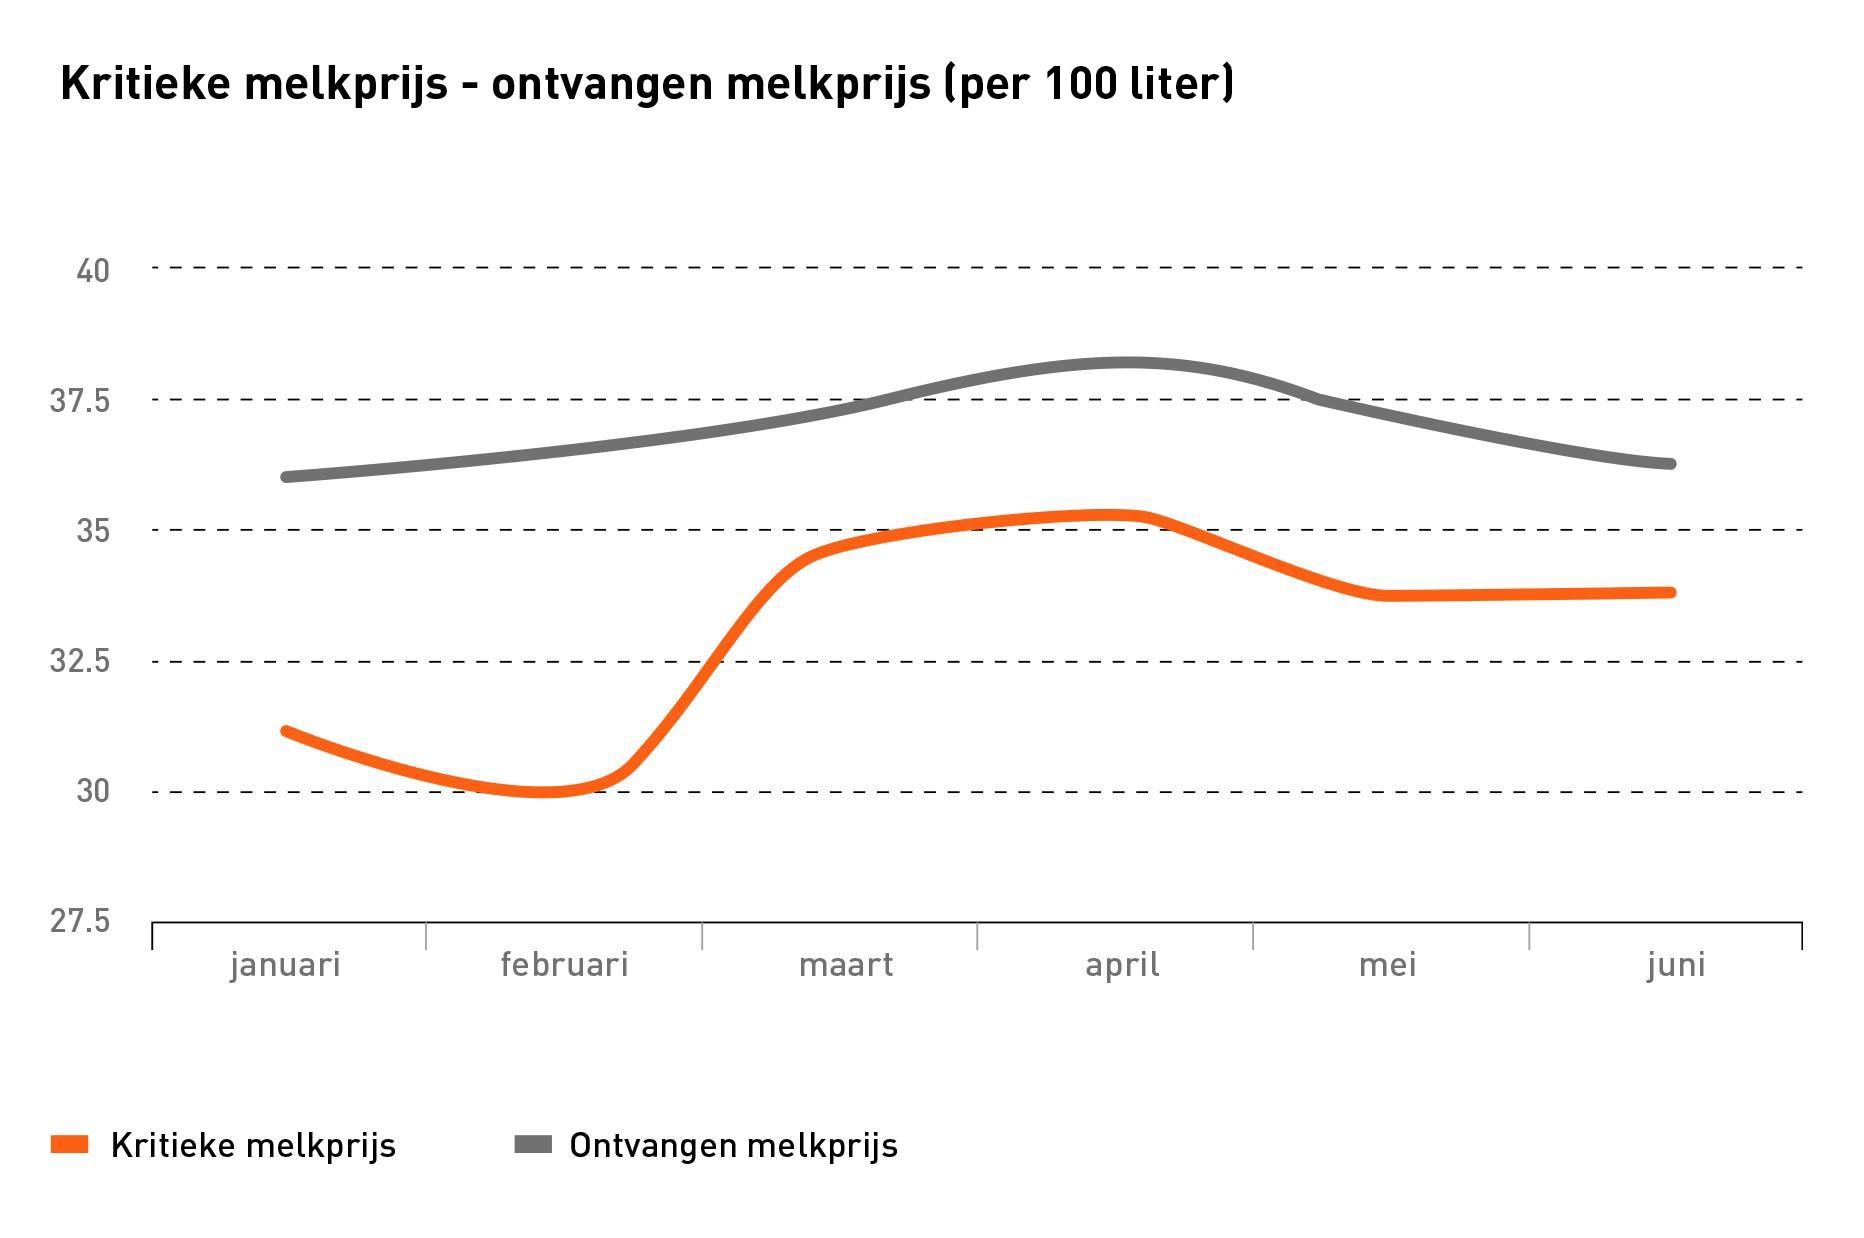
The image shows a fictional example from the agriculture dashboard with specific data for dairy farmers. Click to enlarge.
Did your critical cost price fall? Has your reserve capacity dipped below the benchmark (for example, 7 cents)? Then you’ll easily see this on the dashboard. We’ll review the agriculture dashboard together with you in order to uncover the root cause.
We might spot something unusual in the allocated costs, such as high feed costs or inputs like soil or raw materials. When we detect anomalies or irregularities, we’ll proactively bring them up on our own initiative.
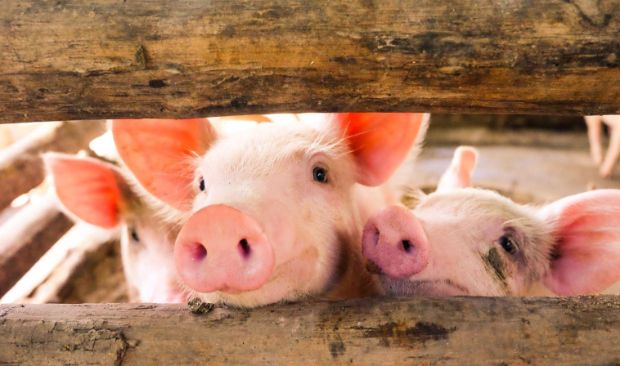
Pig farming
For pig farmers, the Agriculture dashboard provides insight into the margin per average pig. You can even distinguish between finishing pigs and breeding sows. For breeding sows, you can also see the cost price per piglet delivered.
Is your margin per pig, or the cost per piglet, significantly higher or lower than in previous periods? We’ll work with you to figure out why and identify the right follow-up actions.
Arable farming
If you grow or produce crops such as sugar beets or table potatoes, you're probably interested in your margin per hectare. The Agriculture dashboard will provide an accurate answer to that question and more.
Have your margins changed compared to previous periods? With the dashboard, we can work together to quickly and clearly identify where things are off together. This way, you can make timely adjustments to your agriculture business.

Poultry
Poultry farmers get access to a range of financial key figures through the Agriculture dashboard. What you see depends on whether you raise broilers or laying hens:
- Raising broilers? You'll get insight into the margin per average broiler present.
- Keeping laying hens? Then you'll see metrics like the margin per (average) 100 hens, and the number of eggs per hen on average.
The dashboard also lets you compare margins and production volumes with previous periods. If you notice (relatively large) differences, we’ll work with you to get to the root cause, so you can adjust and optimise your agricultural business.

Fair is fair: running an agriculture business has been – and is poised to be – a considerable challenge. Let's explore what's best for you and your business.
The agricultural sector is constantly changing, due in part to rapidly changing laws and regulations and the highly fluctuating market. As a result, agricultural business owners can never quite sit still. Let's face the challenges together!